Developer Guide
Table of contents
- Acknowledgements
- Design & implementation
- Product Scope
- User Stories
- Non-Functional Requirements
- Glossary
- Instructions for manual testing
Acknowledgements
Xchart (A Simple Charting Library for Java)
- author: KNOWM
- source: https://knowm.org/open-source/xchart/
JSON Simple (simple Java toolkit for encoding and decoding JSON)
- author: Yidong Fang (Google Code)
- source: https://code.google.com/archive/p/json-simple/
Apache Common Langs 3
- author: Apache Commons
- source: https://commons.apache.org/proper/commons-lang/
Alpha Vantage Stock Market API
- author: Alpha Vantage
- source: https://www.alphavantage.co/
Gson Java library
- author: Google
- source: https://github.com/google/gson
Financial Modeling Prep Stock API
- author: Financial Modeling Prep
- source: https://site.financialmodelingprep.com/
round() method in Cashflow.java
- author: mhadidg
- source: https://stackoverflow.com/questions/2808535/round-a-double-to-2-decimal-places
capitalize() method in Cashflow.java
- author: Nick Bolton
- source: https://stackoverflow.com/questions/1892765/how-to-capitalize-the-first-character-of-each-word-in-a-string
DG adapted from
Design & implementation
Architecture Diagram
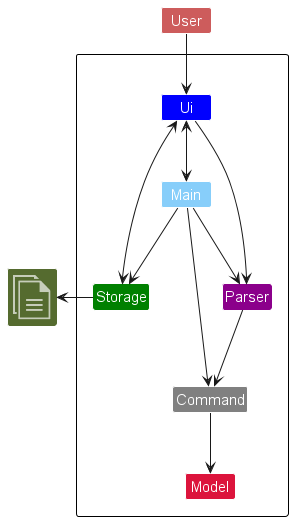
The Architecture Diagram given above explains the high-level design of the program.
Main components of the architecture
Main consists of the FinancialPlanner class, and is in charge of starting up and shutting down the app.
The program consists of five main components:
Ui: User interactions.Parser: Parse user inputs.Command: The command executor.Model: Holds the data of the program in memory.Storage: Reads data from, and writes data to the hard disk.
Storage Component
API: Storage.java
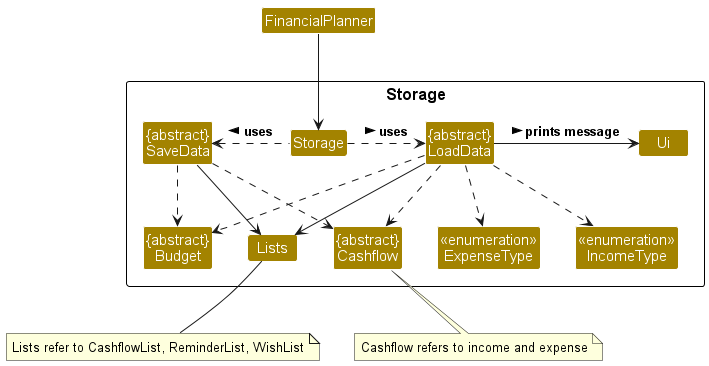
- The storage component loads data from the saved text files when the application starts, and saves the data to the text files when the application exits.
- The storage class uses the static methods in LoadData and SaveData to load and save data respectively.
- The
loadmethod in LoadData reads thedata.txtfile and loads any existing Income, Expense and Budget into the application. - The
savemethod in SaveData saves all Incomes, Expenses and existing Budget into thedata.txtfile.
Design considerations:
- There are 2 main ways to implement the storage, one is to save the data after every command, and the other is to save
the data one upon exiting the program with the
exitcommand. - Option 1 (Currently implemented): Saving the data once upon exit
- Advantage: Better efficiency and performance of the program.
- Disadvantage: If the program crashes or exits incorrectly, data will not be saved.
- Option 2: Saving the data after every command:
- Advantage: Changes are saved after every command.
- Disadvantage: Executing command might slow down the program when there is a large amount of data to be saved.
Option 1 is chosen to prioritise the performance of the program.
Visualization Feature
This feature is implemented with the help of XChart, a simple charting library for Java by Knowm.
By typing in the vis command with the appropriate arguments (/s and /t), users will be able to visualize their
income or expense using visualization tools (Piechart, Bar Chart or Radar Chart)
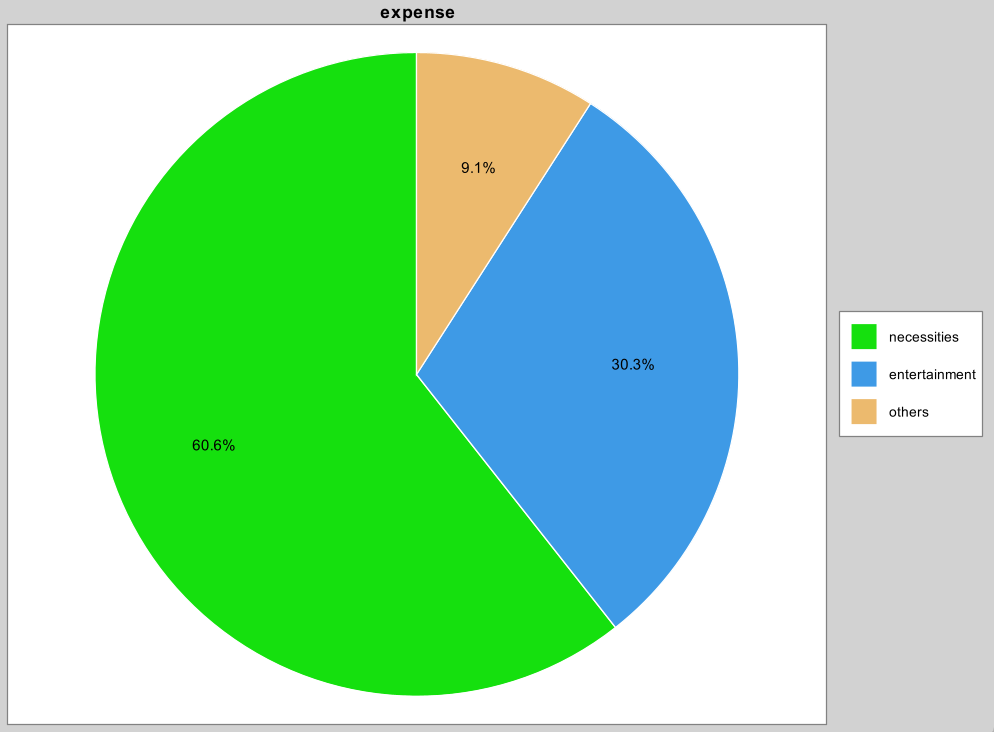
Demo:
vis /t expense /c pie
Output:
Displaying piechart for expense
A message will be shown telling you that the chart is being displayed
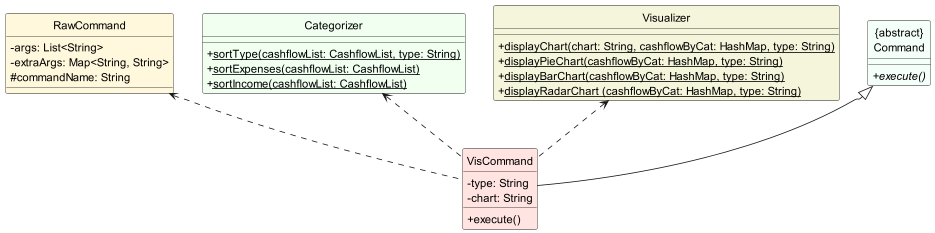
This feature was implemented with the help of three different classes. They are namely: Visualizer, Categorizer, VisCommand (Inherits from abstract Command Class)
VisCommand’s Role:
1) Read the parameters of the vis command entered by the user
/tReads the type of cashflow that the user wants to visualize (income/expense)/cReads the type of visualization tools the user wants (piechart/barchart)
2) Calls the Categorizer to sort cashflow (Income/Expense) according to type
3) Calls the Visualizer to display the chart to the user
As with other Commands in our Financial Planner application, the constructor of VisCommand takes RawCommand as parameter. The RawCommand would provide the arguments (chart type and cashflow type) for the VisCommand provided.
The VisCommand also inherits from the abstract Command class which would provide the execute() abstract method that would be called in main().
Categorizer’s Role:
According to the cashflow type (Income/Expense) arugment passed in, the Categorizer sorts the specified cashflow entry according to type using a Hashmap which is returned and used by the Visualizer
Visualizer’s Role:
According to the chart type (Pie/Bar/Radar) argument and the Hashmap obtained from the categorizer passed in, the visualizer displays the specified visualization chart by calling the charting library Xchart.
Class Diagram
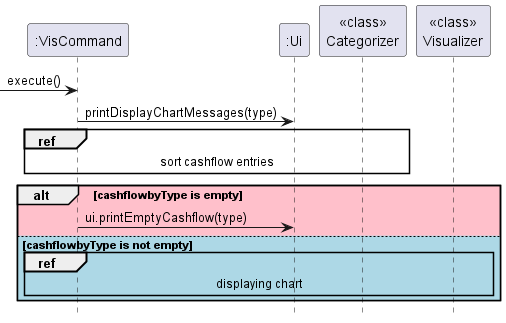
Sequence Diagram
Overall
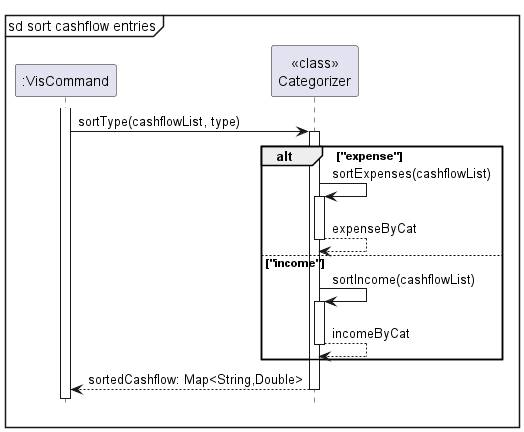
Categorizer (sort cashflow entries ref from overall sequence diagram above)
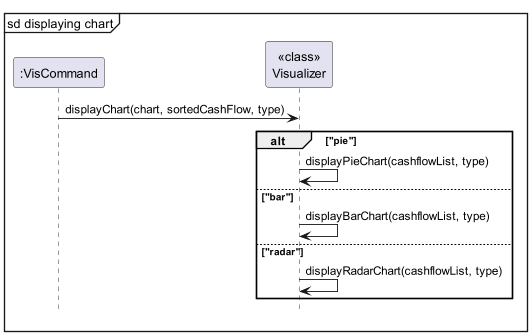
Visualizer (displaying chart ref from overall sequence diagram above)
Watchlist Feature
The watchlist in financial planner is similar to that of other common watchlist online. It contains a list of stocks that the user watches with an eye toward taking advantage of prices. It allows users to track real time data on the stocks that they are interested in.
Simply type watchlist into the command line without any arguments and the watchlist will be displayed.
Example Output:

Below are the various classes involved in the implementation of watchlist.
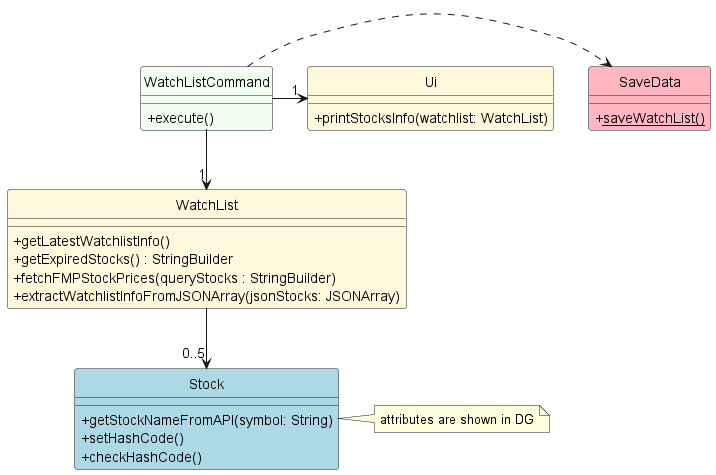
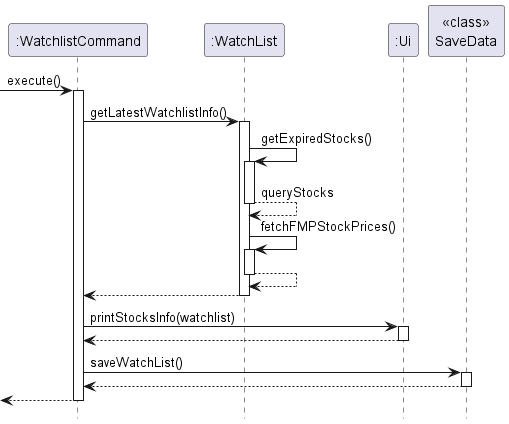
WatchlistCommand
- The WatchlistCommand instance calls the
getLatestWatchListInfo()method from the watchlist class to update the stocks data in the watchlist. - It then calls the
printStocksInfo()method of the Ui class to print out the watchlist. - Finally, it calls the static
saveWatchList()method of the SaveData class to save the watchlist info to watchlist.json.
Watchlist
The watchlist class keeps a record of the stocks that the user is interested in using a hashmap as shown.
private HashMap<String, Stock> stocks;
- When its method
getLatestWatchListInfo()is invoked, it callsgetExpiredStocks()to get the list of stocks that has expired and should be renewed with latest info. - With the list of expired stocks, it calls
fetchFMPStockPrices()which connects to Financial Modeling API to retrieve the latest stock prices and callsextractWatchListInfoFromJSONArray()to update the stocks in the Hashmap with the latest stock data.
Stock
Stocks class objects are the values that make up the stocks hashmap in the watchlist. They cache the stock data obtained from the API as attributes of the class.
private String symbol;
private String exchange;
private String stockName;
private String price;
private String dayHigh;
private String dayLow;
private Date lastUpdated = null;
private long lastFetched = 0;
private int hashCode = 0;
Shown above is a complete list of attribute of the stock class.
lastFetched and hashCode are attributes that are not related to the stock financial data.
lastFetched is used for caching validity checking and hashCode is used to tell whether saved values on disk
are corrupted.
Watchlist Class Diagram (Simplified)
Watchlist sequence Diagram (Simplified)
Add Income/Expense Feature
The add income/expense command has 2 compulsory arguments /t and /a and 2 optional argument /r and /d.
Example:
add income /a 100 /t salary /r 30 /d work
Below are the steps that shows the implementation of add income/expense.
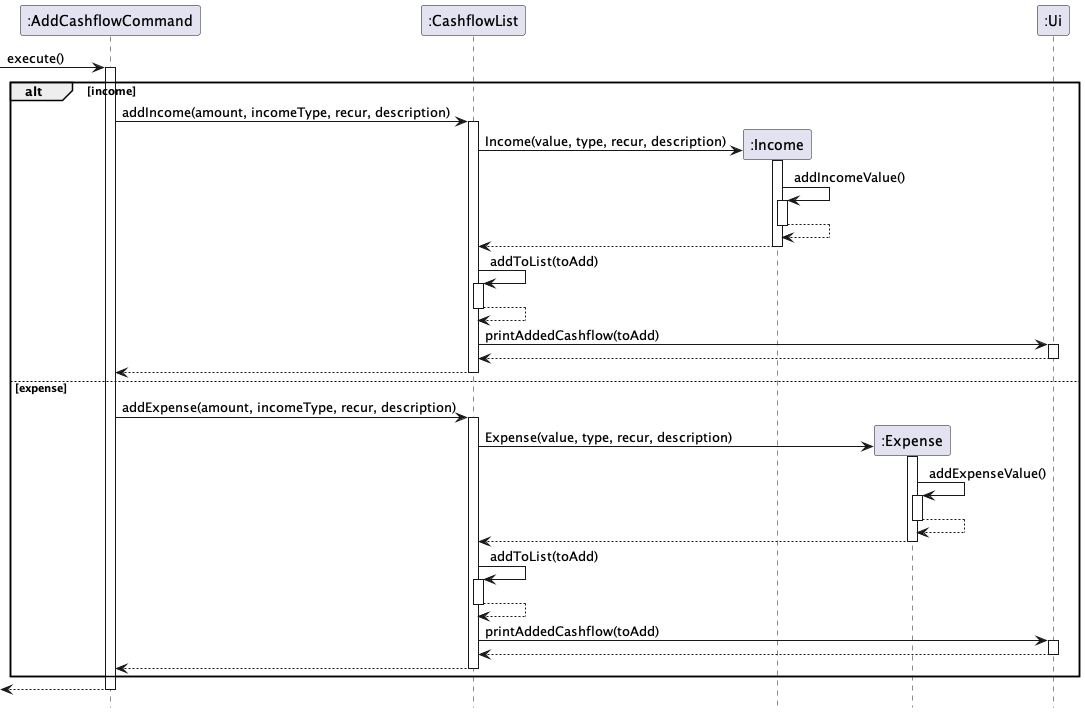
Step 1
The AddCashflowCommand instance calls addIncome() or addExpense(), depending on what category is initialised as.
addIncome() or addExpense() instantiates an Income or Expense object respectively.
Example:
switch (category) {
case INCOME:
    cashflowList.addIncome(amount, incomeType, recur, description);
    break;
case EXPENSE:
    cashflowList.addExpense(amount, expenseType, recur, description);
    break;
default:
    ui.showMessage("Unidentified entry.");
    break;
}
Step 2
The instantiated income/expense then updates the overall balance through addIncomeValue() or addExpenseValue().
The income/expense object is also added to the list in Cashflowlist which contains all incomes/expenses.
Step 3
The added income/expense is then displayed to the user through the Ui.
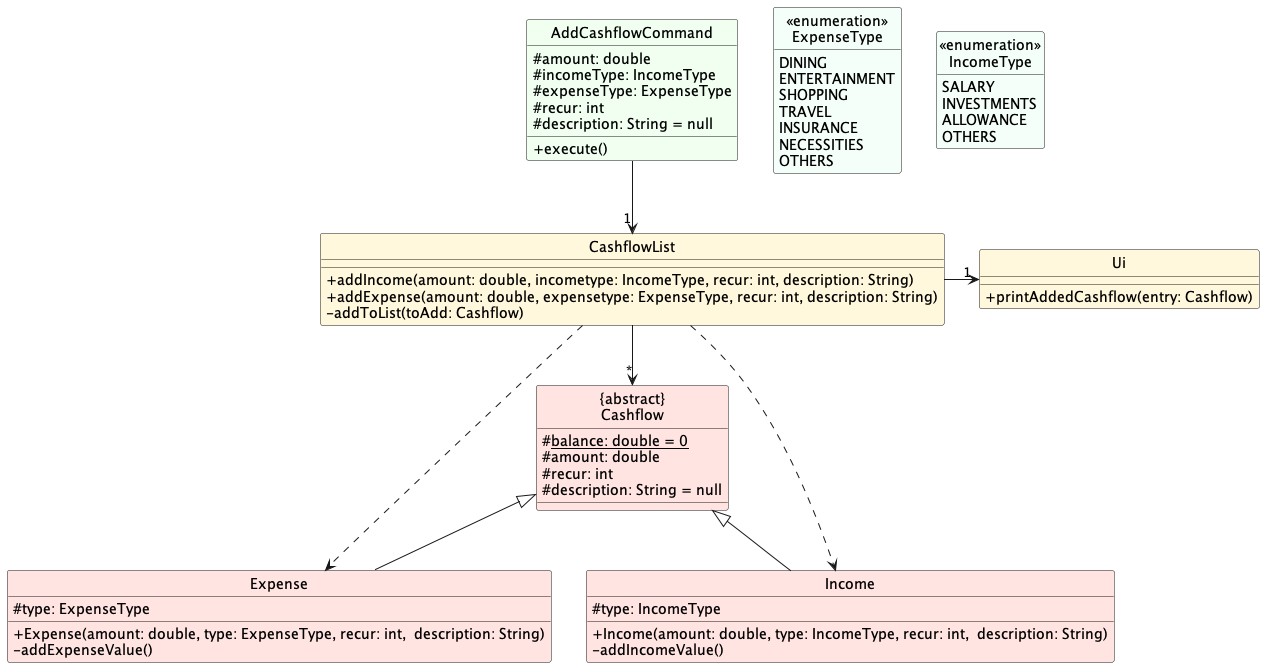
Add Income/Expense Class Diagram
Given below is the class diagram showing the class structure of the add income/expense mechanism:
Add Income/Expense Sequence Diagram
Given below is the sequence diagram showing the add income/expense mechanism:
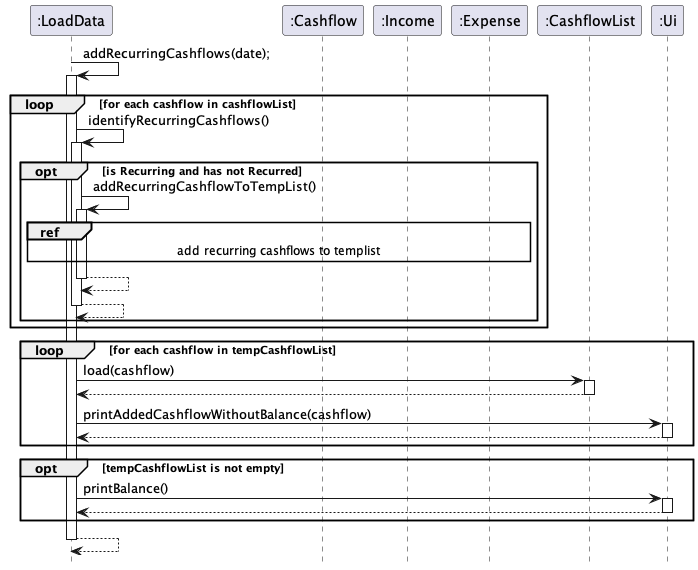
Recurring Cashflow Feature
Cashflow refers to an income or expense.
This feature is called from the user through the /r argument in add income/expense command.
If a cashflow is set to be recurring, the program would add another entry of the same cashflow to the Financial Planner after a set period of time.
Below are the steps that shows the implementation of the recurring cashflow feature.
Step 1
Once the cashflow is set to be recurring, its corresponding Cashflow object would store the date at which the cashflow was added to the Financial Planner.
The recur variable in the object would also be instantiated according to the user’s input.
An additional boolean variable, hasRecurred is stored in the object and is set to false by default.
Example:
public abstract class Cashflow {
    protected int recur;
    protected LocalDate date;
    protected boolean hasRecurred;
}
Step 2
When the Financial Planner is started again in the future, the date of startup would be obtained from the system.
After loading existing saved cashflows from data.txt, the program will check for cashflows that are set to be recurring and has not recurred.
Example:
if (recur > 0 && !hasRecurred) {
    ...
}
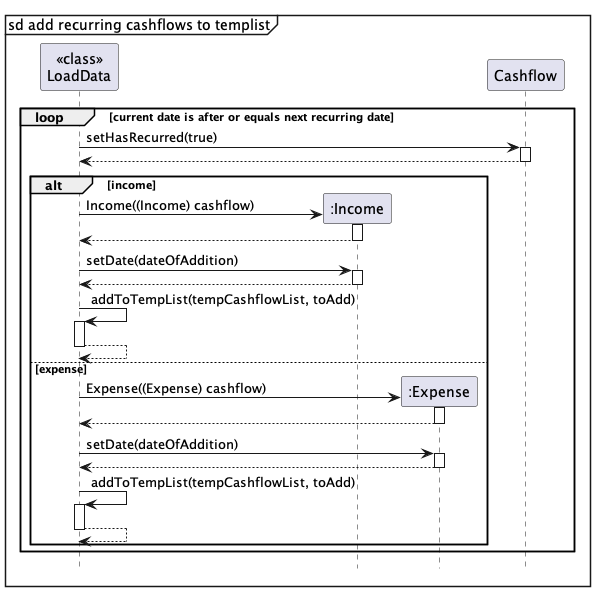
Step 3
Once a cashflow matches the above criteria, the date of its next addition to the Financial Planner, dateOfAddition, would be determined.
dateOfAddition would be compared to the current date, and if the current date is after or equal to dateOfAddition, an identical cashflow would be instantiated.
This identical cashflow would then have its date variable set to dateOfAddition, then this cashflow would be added to a temporary list, tempCashflowList.
The original cashflow would then have its hasRecurred variable be set to true.
Step 4
Each cashflow in tempCashflowList goes through Step 3 again, so that multiple cashflows can be added if it has recurred more than once.
Once the process is done, all cashflows in tempCashflowList are then added to the Financial Planner.
The added cashflows are then displayed to the user.
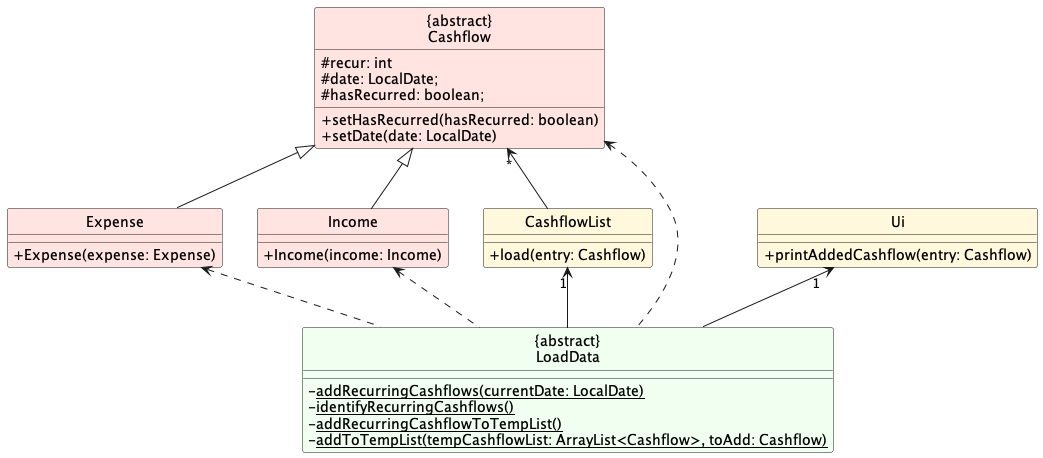
Recurring Cashflow Class Diagram
Given below is the class diagram showing the class structure of the recurring cashflow mechanism:
Recurring Cashflow Sequence Diagrams
Given below is the sequence diagram showing the recurring cashflow mechanism:
Budget Feature
This feature has 5 functions, set, update, delete, reset, and view.
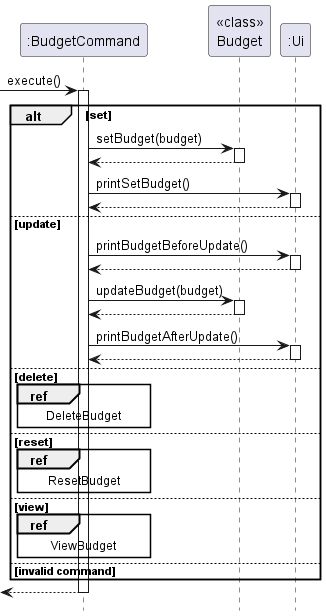
The BudgetCommand will execute the appropriate command and print through Budget.java and prints any message to the user through Ui.java.
Set and update budget:
Example:
budget set /b 500
budget update /b 1000
The /b is followed by the budget amount.
Set budget:
The first line will set the budget by calling setBudget(500) method in Budget.java. The setBudget(500) method then sets the
initialBudget and currentBudget variable to the input amount, in this case 500.
Update budget:
The second line updates the budget by adding or subtracting the difference between the initial and updated amount to initialBudget
and currentBudget. This is done through updateBudget(1000) method in Budget.java. In the example above, since the budget is
being updated from 500 to 1000, 500 will be added to the variables initialBudget and currentBudget. Both functions can be seen
in the diagram above.
Delete budget:
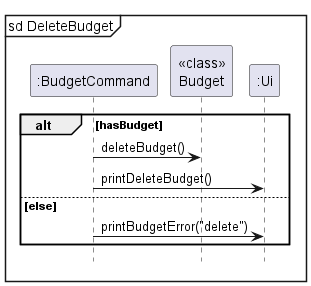
The budget will be deleted by setting the initialBudget and currentBudget variables to 0 through the deleteBudget() method in Budget.java.
Example: budget delete
Reset budget:
The budget will be reset by resetting the currentBudget variable to the initialBudget variable through the resetBudget() method in Budget.java.
Example: budget reset
View budget:
The currentBudget will be shown to the user through the Ui.
Example: budget view
Mark Goal Feature
The mark goal command has 1 compulsory argument INDEX.
Example:
markgoal 1
Below are the steps that shows the implementation of set goal.
Step 1
The MarkGoalCommand instance calls markGoal(INDEX) function of wish list.
Step 2
Wish list finds the corresponding goal and calls markAsDone() function of corresponding goal.
Step 3
The marked goal is then displayed to the user through the Ui.
Step 4
The wish list calls addExpense(amount, type, label) function of cashflow list to add corresponding expense.
Step 5
The added expense is then displayed to the user through the Ui.
Mark goal Sequence Diagram
Given below is the sequence diagram showing the markgoal mechanism:
Product scope
Target user profile
Our target user profile is …
- a working adult with a source of income
- someone who dislike navigating graphic user interface
- someone who can type fast
- someone who cannot manage their finances such as income and expenses properly
- unable to reach their financial goals
- is slightly interested in the equity market
- needs reminders for tasks
Value proposition
Our financial planner application can help individuals manage their finances effectively and achieve their financial goals. The purpose of such an application is to provide users with a range of tools and features to help them better understand their financial situation. This will enable them to make more informed decisions, and plan for their future financial well-being. The application will allow the user to keep track of their income, expenses and overall balance. It also lets the user view their income and expenses using visualization tool to have a better view of their cash flow based on categories. It also allows the user to set the budget for the month. It also allows users to add their financial goals to the wishlist. Furthermore, it allows users to track the stock market if they have interest in investing in equities.
User Stories
| Version | As a … | I want to … | So that I can … |
|---|---|---|---|
| v1.0 | user | Add my income | Store my income information and view/track them later |
| v1.0 | user | Delete my income | Remove the income entry that I have mistakenly added or do not keep track |
| v1.0 | user | Add my expense | Store my expense information and view/track them later |
| v1.0 | user | Delete my expense | Remove the expense entry that I have mistakenly added or do not keep track |
| v2.0 | user | set my expense type | Break down my expenses into different categories |
| v1.0 | user | set my income type | Break down my income into different categories |
| v2.0 | user | Add recurring cash flows | add a regular expense or income (salary, rent) easily |
| v2.0 | user | Delete recurring cash flows | delete a regular expense of income easily |
| v1.0 | user | list all cash flow entries | view all my income and expenses in a comprehensive list |
| v1.0 | user | list all expenses entries | view all my expenses in a comprehensive list |
| v1.0 | user | list all income entries | view all my income in a comprehensive list |
| v2.0 | user | list all recurring cash flows | view all my recurring income or expenses in a comprehensive list |
| v2.0 | new user | see usage instructions | refer to them when I forget how to use the application |
| v1.0 | user | set a budget | keep track of a budget together with my cash flow and ensure I do not exceed it |
| v1.0 | user | update the budget | make changes to the budget according to my needs |
| v1.0 | user | reset the budget | return to my initial budget easily |
| v1.0 | user | delete budget | remove the budget that I no longer want to keep track of |
| v1.0 | user | view budget | keep track of the amount of budget I have left |
| v1.0 | user | see overview of the app | see the overall view of all income, expense and overall balance as well as reminders |
| v1.0 | user | view balance | see my overall balance according to the income and expenses I am keeping track |
| v1.0 | investment enthusiast | view my watchlist | keep track of stocks that I am interested in |
| v2.0 | investment enthusiast | add new stocks to watchlist | add new stock that I am interested in investing in |
| v2.0 | investment enthusiast | delete stocks from watchlist | remove stocks that I am no longer interested in |
| v1.0 | user | add reminder | add reminders (eg to pay loans) so I will not forget |
| v1.0 | user | delete reminder | delete reminders that I no longer want to keep track |
| v1.0 | user | mark reminder | set the reminder as completed |
| v1.0 | user | view wishlist | keep track of my goals easily |
| v1.0 | user | set goals | add a new goal to my that I think of |
| v1.0 | user | delete goals | remove goals that I can no longer achieve |
| v1.0 | user | mark goal | that I have achieved |
| v1.0 | user | visualize my cash flow | easily see where the distribution for my spending and earnings |
Non-Functional Requirements
- Should work on main OS (Windows, Linux, Mac) that has Java 11 installed.
- This app is meant for a single user.
- This app is targeted towards users with an above-average typing speed.
- Watchlist should work reliably and not crash the application when the 3rd party dependencies are down (API is down)
Glossary
- Cashflow - Refers to an income or expense.
- WishList - A list containing goals/targets.
- Watchlist - A list of stocks that the financial planner is currently tracking
Instructions for manual testing
Given below are instructions to test the app manually
- Note: These instructions only provide a starting point for testers to work on
Launch and shutdown
- Initial Launch
- Download the jar file and copy into an empty folder
- Open up the terminal and run java -jar tp.jar Expected: shows you the welcome screen for the financial planner app
- Closing the application
- Type
exitinto the terminal. - Expected: the financial planner will exit with a goodbye message. Under the data newly created data directory, a watchlist.json and a data.txt file will be created
- Type
Add cashflow
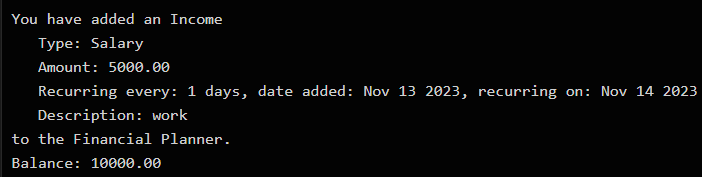
To test the add cashflow feature, you can use the following command:
add income /a 5000 /t salary /r 30 /d work
You should see the following output:
Note: The date displayed will differ based on your system time.
You can also use the following command to test the optional arguments:
add expense /a 1000 /t necessities
You should see the following output:
You have added an Expense
   Type: Necessities
   Amount: 1000.00
to the Financial Planner.
Balance: 4000.00
List
To test the list feature, you can add these test inputs to the program first:
Make sure there is no existing cashflows in the program in order to achieve the exact outputs below. You can clear the inputs by exiting the program and deleting the data.txt file found in data folder.
Make sure to add each command line by line.
add income /a 5000 /t salary /r 30 /d work
add expense /a 1000 /t necessities
add income /a 500 /t investments /d stocks
add expense /a 800 /t insurance /r 365 /d insurance
After which you can test the following commands:
Note: The dates displayed will differ based on your system time.
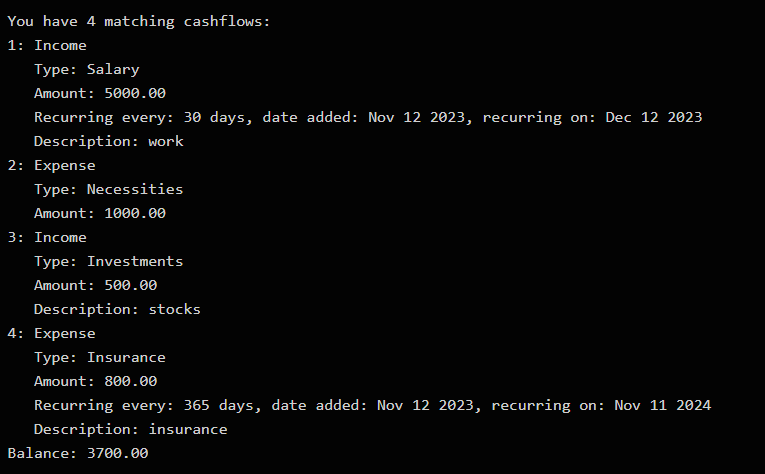
Input: list
Output:
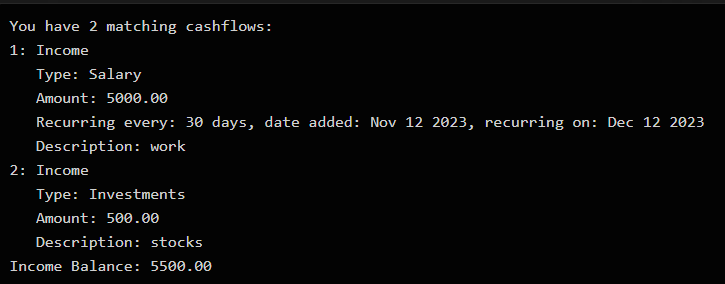
Input: list income
Output:
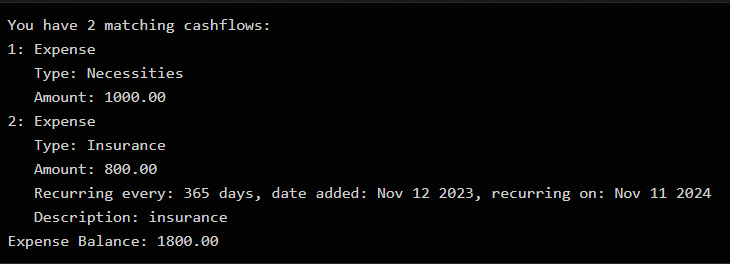
Input: list expense
Output:
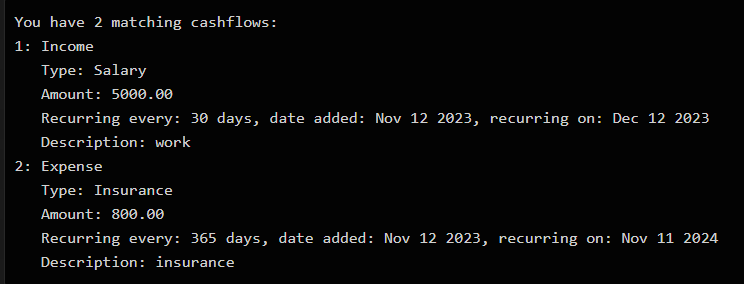
Input: list recurring
Output:
Delete cashflow
You are recommended to test this feature after testing the list feature as they share the same test inputs.
If you have not done so, please follow the instructions to test the list feature here.
To test the delete cashflow feature, you can use the following commands provided below:
Use the list command before each delete command to confirm that the cashflow at the index stated in the delete command matches the expected output.
Note: The dates displayed will differ based on your system time.
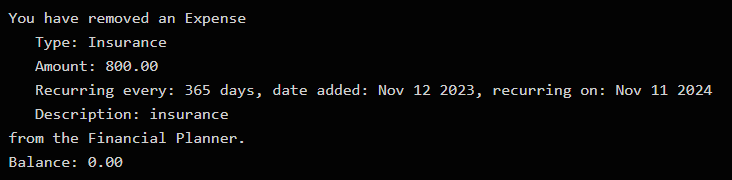
Input: list followed by delete 3
Output:
You have removed an Income
   Type: Investments
   Amount: 500.00
   Description: stocks
from the Financial Planner.
Balance: 3200.00
Input: list income followed by delete income 1 /r
Output:
You have removed future recurrences of this cashflow.
Updated cashflow:
Income
   Type: Salary
   Amount: 5000.00
   Description: work
Input: list income followed by delete income 1
Output:
You have removed an Income
   Type: Salary
   Amount: 5000.00
   Description: work
from the Financial Planner.
Balance: -1800.00
Input: list expense followed by delete expense 1
Output:
You have removed an Expense
   Type: Necessities
   Amount: 1000.00
from the Financial Planner.
Balance: -800.00
Input: list recurring followed by delete recurring 1
Output:
Recurring cashflow
You can test the recurring cashflow feature by manually changing your system time.
First add a cashflow that has a recurrence value. You can use the following example command:
add income /a 5000 /t salary /r 1 /d work
Next, exit the program and change the system time to be ahead by the specified days in the cashflow.
In the case of the example command, you can bring forward the system time by 1 day.
Finally, start the program again and you should see this output:
Note: The dates displayed will differ based on your system time.
View Balance
Test case: balance
Expected: Balance is displayed. Details of balance are shown in the status message.
Budget Feature
- Setting a monthly budget
Test case: budget set /b 100
Expected: A monthly budget of 100 is set. Details of the budget are shown in the status message.
Test case: budget set /b
Expected: No budget is set. Error details shown in status message.
Other incorrect set budget commands to try: budget set, budget set /b x, ... (where x is negative)
- Updating budget
Test case: budget update /b 300
Expected: Monthly budget is updated to 300. Details of the budget are shown in the status message.
Test case: budget update /b
Expected: Budget is not updated. Error details shown in status message.
Other incorrect set budget commands to try: budget update, budget update /b x, ... (where x is negative)
- Resetting budget
Test case: budget reset
Expected (Current budget is lower than initial budget): Budget is reset. Details of reset budget are shown in status message.
Expected (Budget has not been spent): Budget is not reset. Error details shown in the status message.
- Deleting budget
Test case: budget delete
Expected (Budget exists): Budget is deleted. Details of deletion are shown in status message.
Expected (Budget does not exist): No budget to delete. Error details shown in the status message.
- Viewing budget
Test case: budget view
Expected (Budget exists): Budget is displayed. Details of budget are shown in status message.
Expected (Budget does not exist): No budget to display. Error details shown in the status message.
Displaying overview
Test case: overview
Expected: Displays overview of user’s financials. Details of financials are shown in the status message.
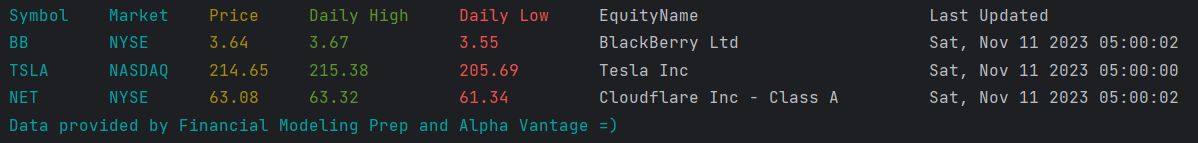
Using Watchlist
To test the watchlist feature, you can copy the text below into the watchlist.json file under data directory
{
  "BB": {
    "symbol": "BB",
    "stockName": "BlackBerry Ltd"
  },
  "TSLA": {
    "symbol": "TSLA",
    "stockName": "Tesla Inc"
  }
}
Start Financial Planner app and you should be able to see this output (although prices will differ) after running the watchlist command

You can then add a stock using the command below
addstock /s NET
You should see a message stating that Cloudflare was added. After running the watchlist command again and exiting the application, your watchlist output should look like this
You can also remove stocks from the command. Run these commands separately
deletestock /s BB
deletestock /s TSLA
deletestock /s NET
After deleting all the stocks and running the watchlist command again, the output should look like this
as you have no more stocks left in your watchlist

Using Visualization
We can use the visualization feature to visualize your income and expenses.
First we will add some expenses
add expense /a 1000 /t necessities /d Iphone 15 pro max
add expense /a 4 /t others /d cai png
add expense /a 100 /t travel /d JB
Now we can visualize these expenses using 3 different charts (pie/bar/radar)
vis /t expense /c pie
vis /t expense /c bar
vis /t expense /c radar
You can run the 3 commands separately to see different charts
We can do the same for income. Add some entries
add income /a 1800 /t salary /d mcd
add income /a 400 /t investments /d Gamestop
add income /a 100 /t allowance /d parents
Again we can visualize these income using 3 different charts in separate commands (pie/bar/radar)
vis /t income /c pie
vis /t income /c bar
vis /t income /c radar
Saving data
Dealing with missing/corrupted data files:
Example of a valid data.txt file:
I | 5000.0 | SALARY | 30 | false | 31/10/2023
E | 50.0 | OTHERS | 0 | false
I | 500.0 | OTHERS | 0 | false
I | 5.0 | OTHERS | 0 | false
E | 5.0 | OTHERS | 0 | false
The first column specifies the type of data being saved, and the subsequent columns contain the data to be saved.
For example, I and E represent income and expense respectively, and there are other types, such as B for budget.
For incomes and expenses, the second column represent the amount, which is a double. To simulate a corrupted data, you
can change the number in the column to a string for example.
Example of corrupted data.txt file in the third row:
I | 5000.0 | SALARY | 30 | false | 31/10/2023
E | 50.0 | OTHERS | 0 | false
I | sdf | OTHERS | 0 | false
I | 5.0 | OTHERS | 0 | false
E | 5.0 | OTHERS | 0 | false
When starting the program:
Expected: Data fails to load. Error details shown in status message. Program asks user if he/she wants to create a new file (by clearing all data) or fix it manually.